
EveryDay Labs Pro
EveryDay Labs uses data and behavioral science to reduce absenteeism in public schools. In 2021, they wanted to launch a Pro platform to give school officials access to attendance data and case management tools.
BACKGROUND
Making Data Actionable
Data and behavioral science is the basis for all of EveryDay Labs’ work, from how they analyze attendance patterns to the intervention methods they recommend. All of that complex work was presented to their school district clients in Tableau graphs and various documents. They wanted to create a user-friendly platform where clients could view school and student data, as well as manage student interventions. Their product leader had started roughly sketching an application, so I was brought on board to complete the vision.
Role
UX designer
UI designer
Visual designer
Deliverables
Wireframes
High-fidelity interactive prototypes
Style guide

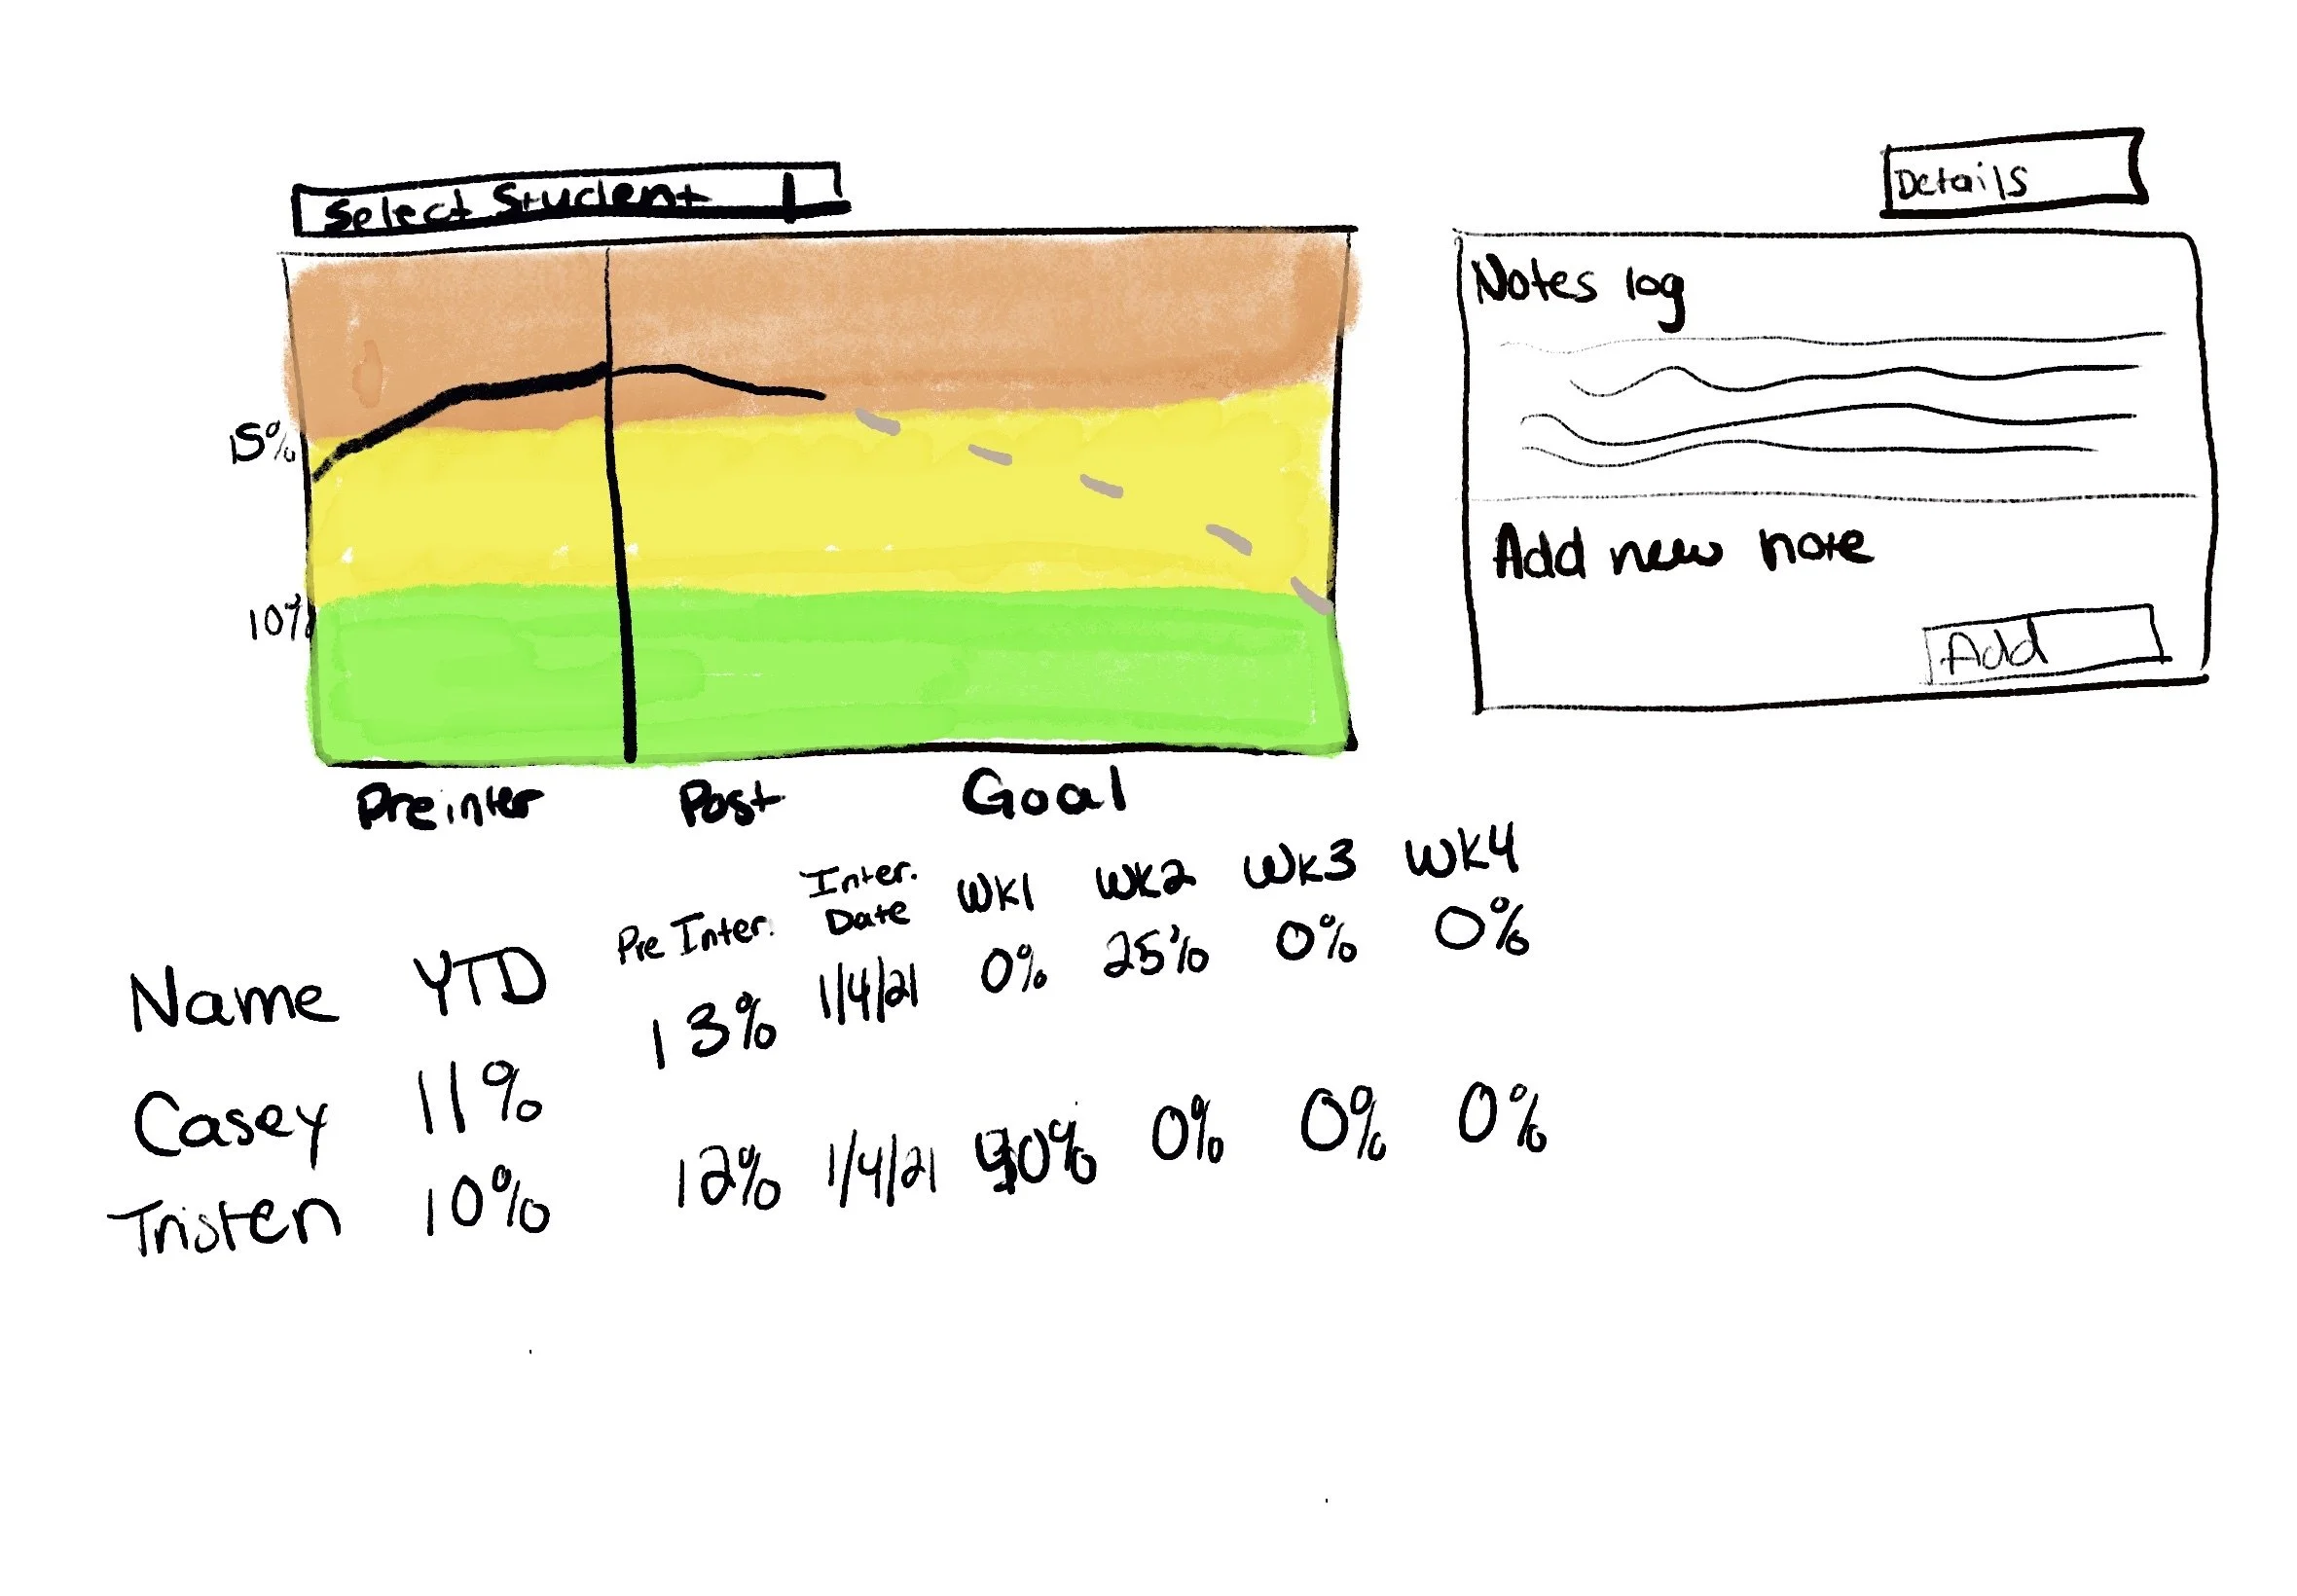
Initial app concept sketches I was provided when starting the project.
APPROACH
Understanding Absenteeism
Being new to this space, I started by diving into EveryDay Labs data and learning about absenteeism. I interviewed client-facing team members, read case studies, reviewed client data in Tableau, and researched absenteeism. This was a practice I maintained throughout the project to ensure I had an accurate understanding of the work clients were doing.
DESIGN
Sitemap & Wireframes
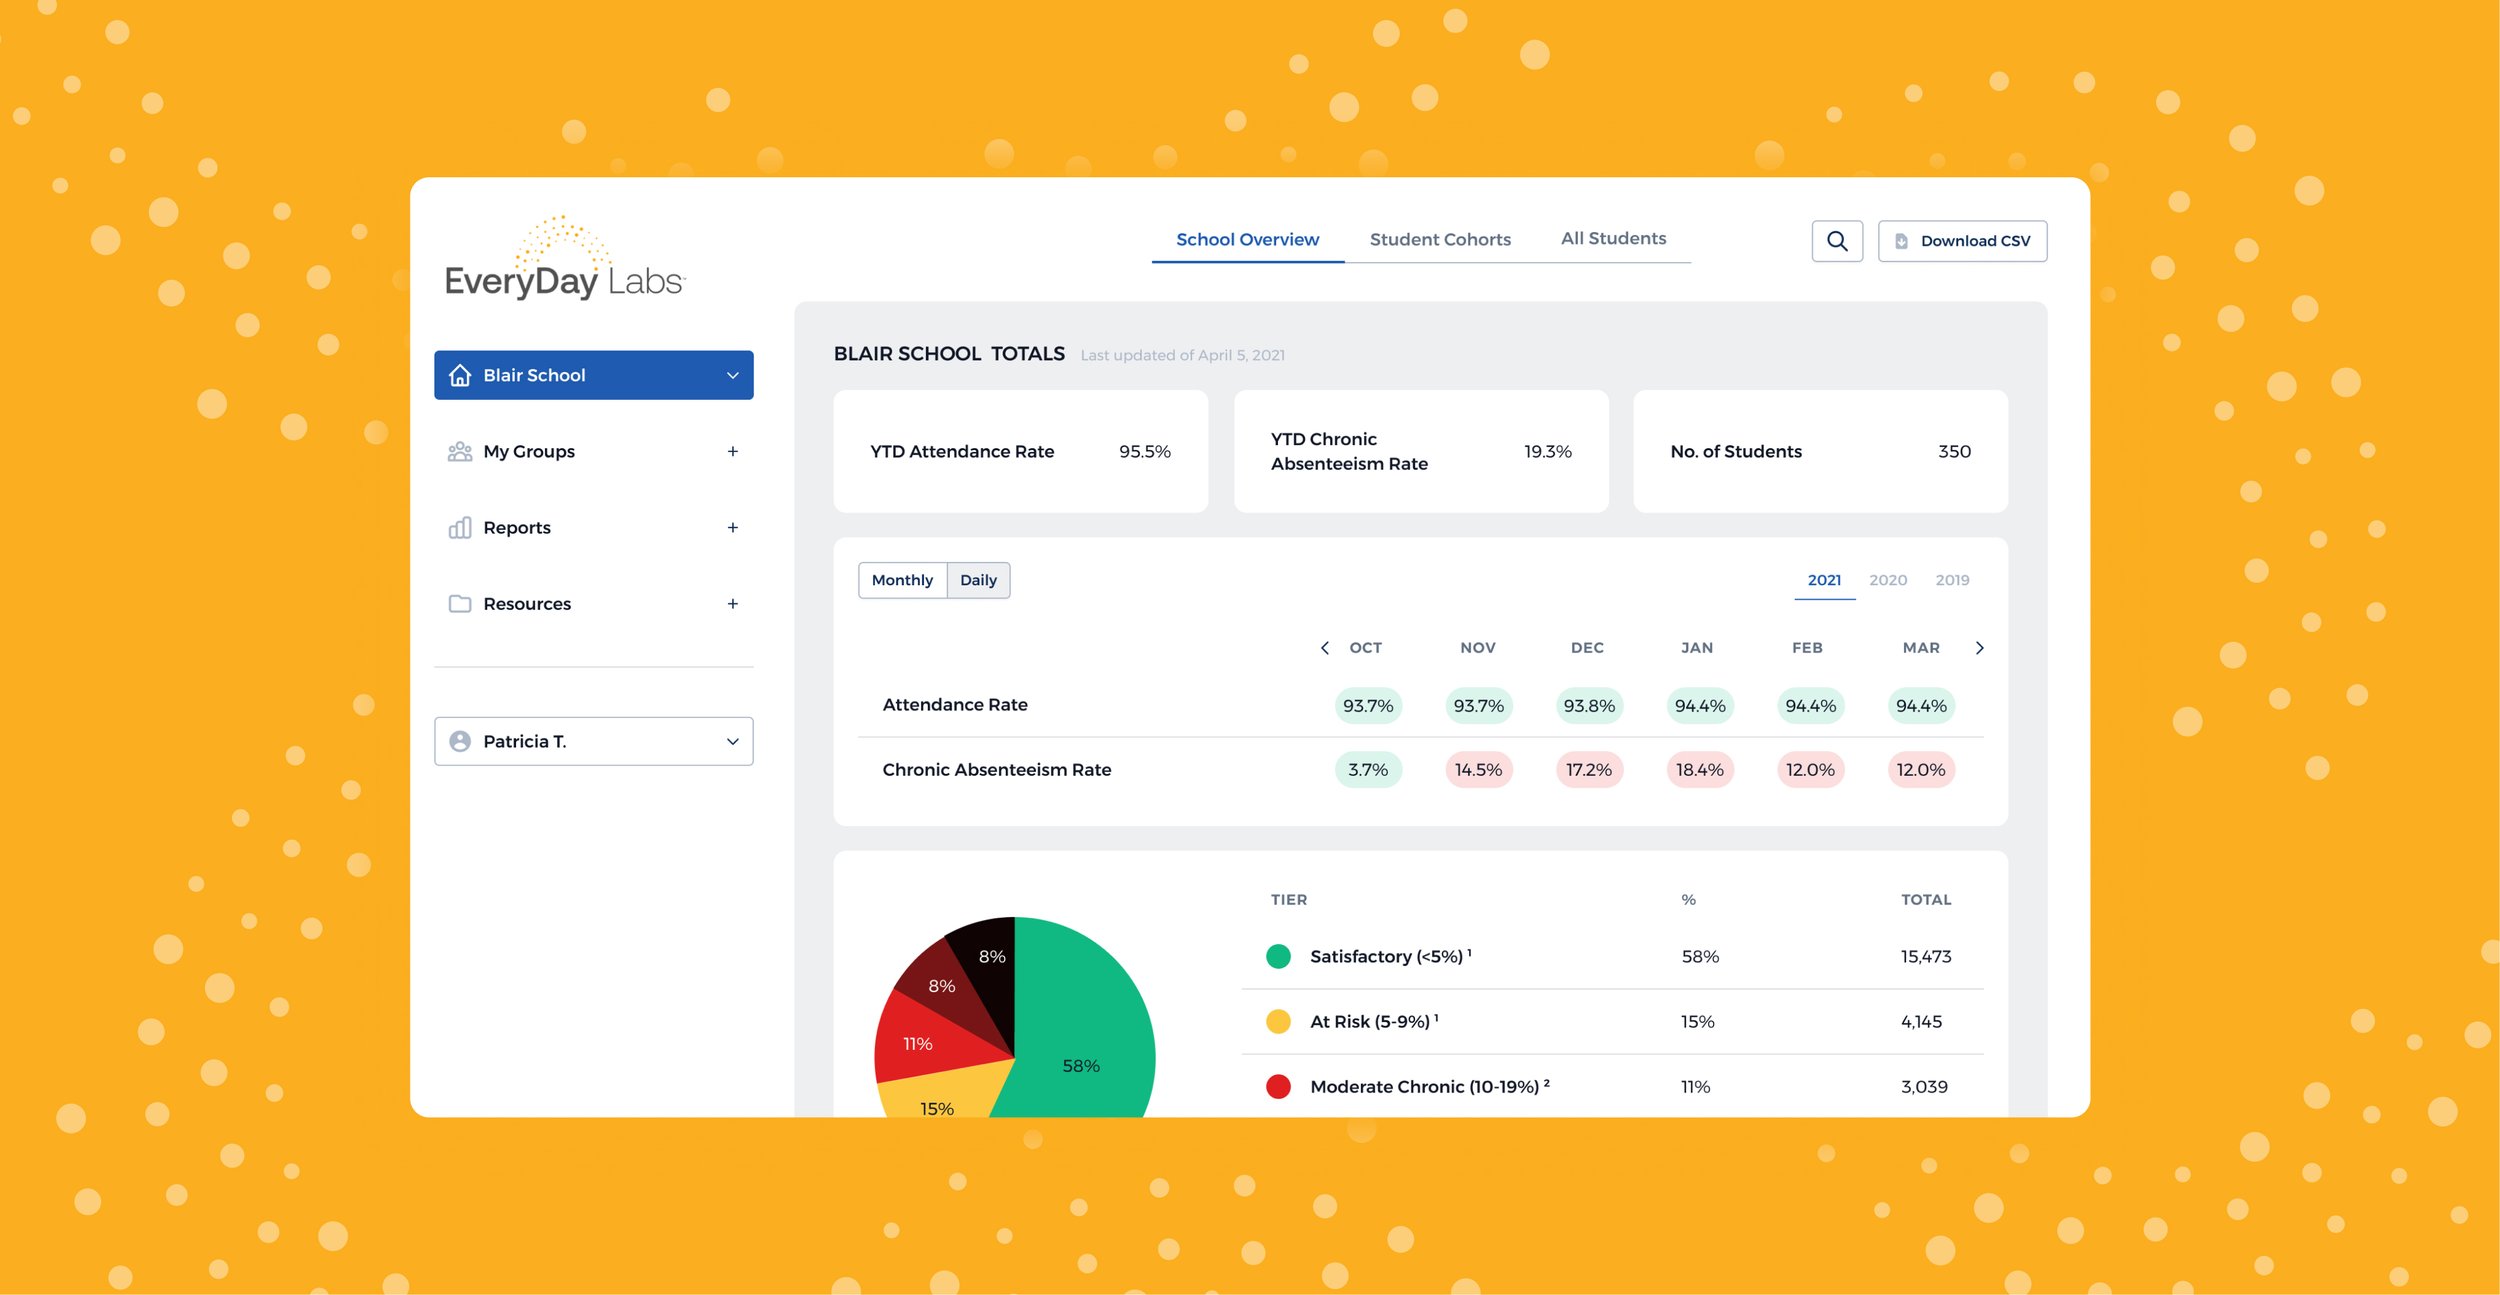
Taking the product lead’s early sketch concepts, I created a sitemap to organize the app content. Once validated by the team, I got started on wireframes. To expedite the build, engineering chose to utilize Tailwind UI components. Data was the backbone of the platform, so a lot of time was spent ensuring data was displayed accurately and compellingly. I worked closely with the product and engineering leads throughout the project to ensure designs were going in the right direction, bringing in other team members as needed to validate design decisions.
Interactive Prototypes
& Style Guide
Moving to high-fidelity designs, I made interactive prototypes to demonstrate important interactions.
The most important data set on the platform is absence rates, which determine users’ workloads and subsequent actions. Since users would be scanning and analyzing data for hundreds of students at any given time, I developed an accessible color palette for all data. For the rest of the UI, I used a minimalist palette to ensure data remained the dominant visual.
I accepted a full-time position as the build was underway. To set the team up for success as I transitioned off the project, I created a UI style guide for the engineers to reference as they continued their work.


Various screens and components.
